Dashboard Trigger
Trigger GitAuto from the coverage dashboard by selecting specific files. This method provides a visual interface for targeted test generation with coverage data insights.
Why use the dashboard trigger?
Visual File Selection: Browse your repository files with coverage percentages displayed, making it easy to identify which files need tests.
Bulk Operations: Select multiple files at once and create PRs for all of them simultaneously, saving time on large repositories.
Perfect for: Teams managing large codebases and QA managers tracking coverage metrics systematically.
How to use the dashboard trigger
Sign in to the GitAuto dashboard
Click the "Sign in" button in the top right corner and authenticate with your GitHub account.

Select your repository
Select your GitHub organization and repository from the dropdown menus. Only repositories where GitAuto is installed will be displayed.
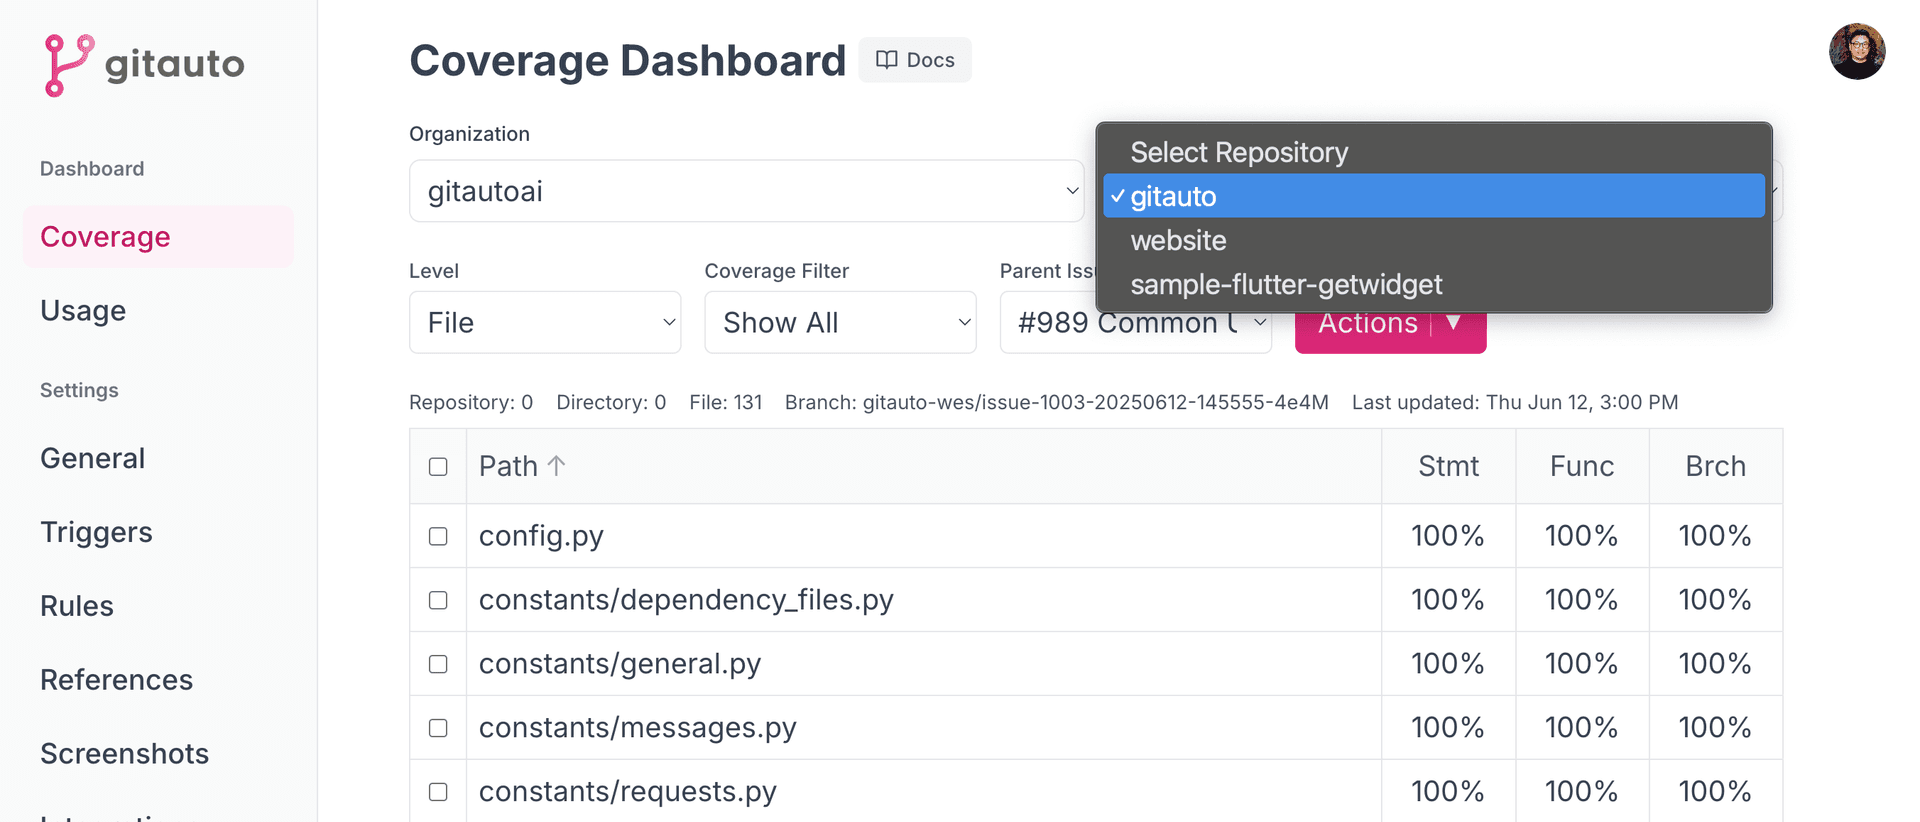
Browse repository files
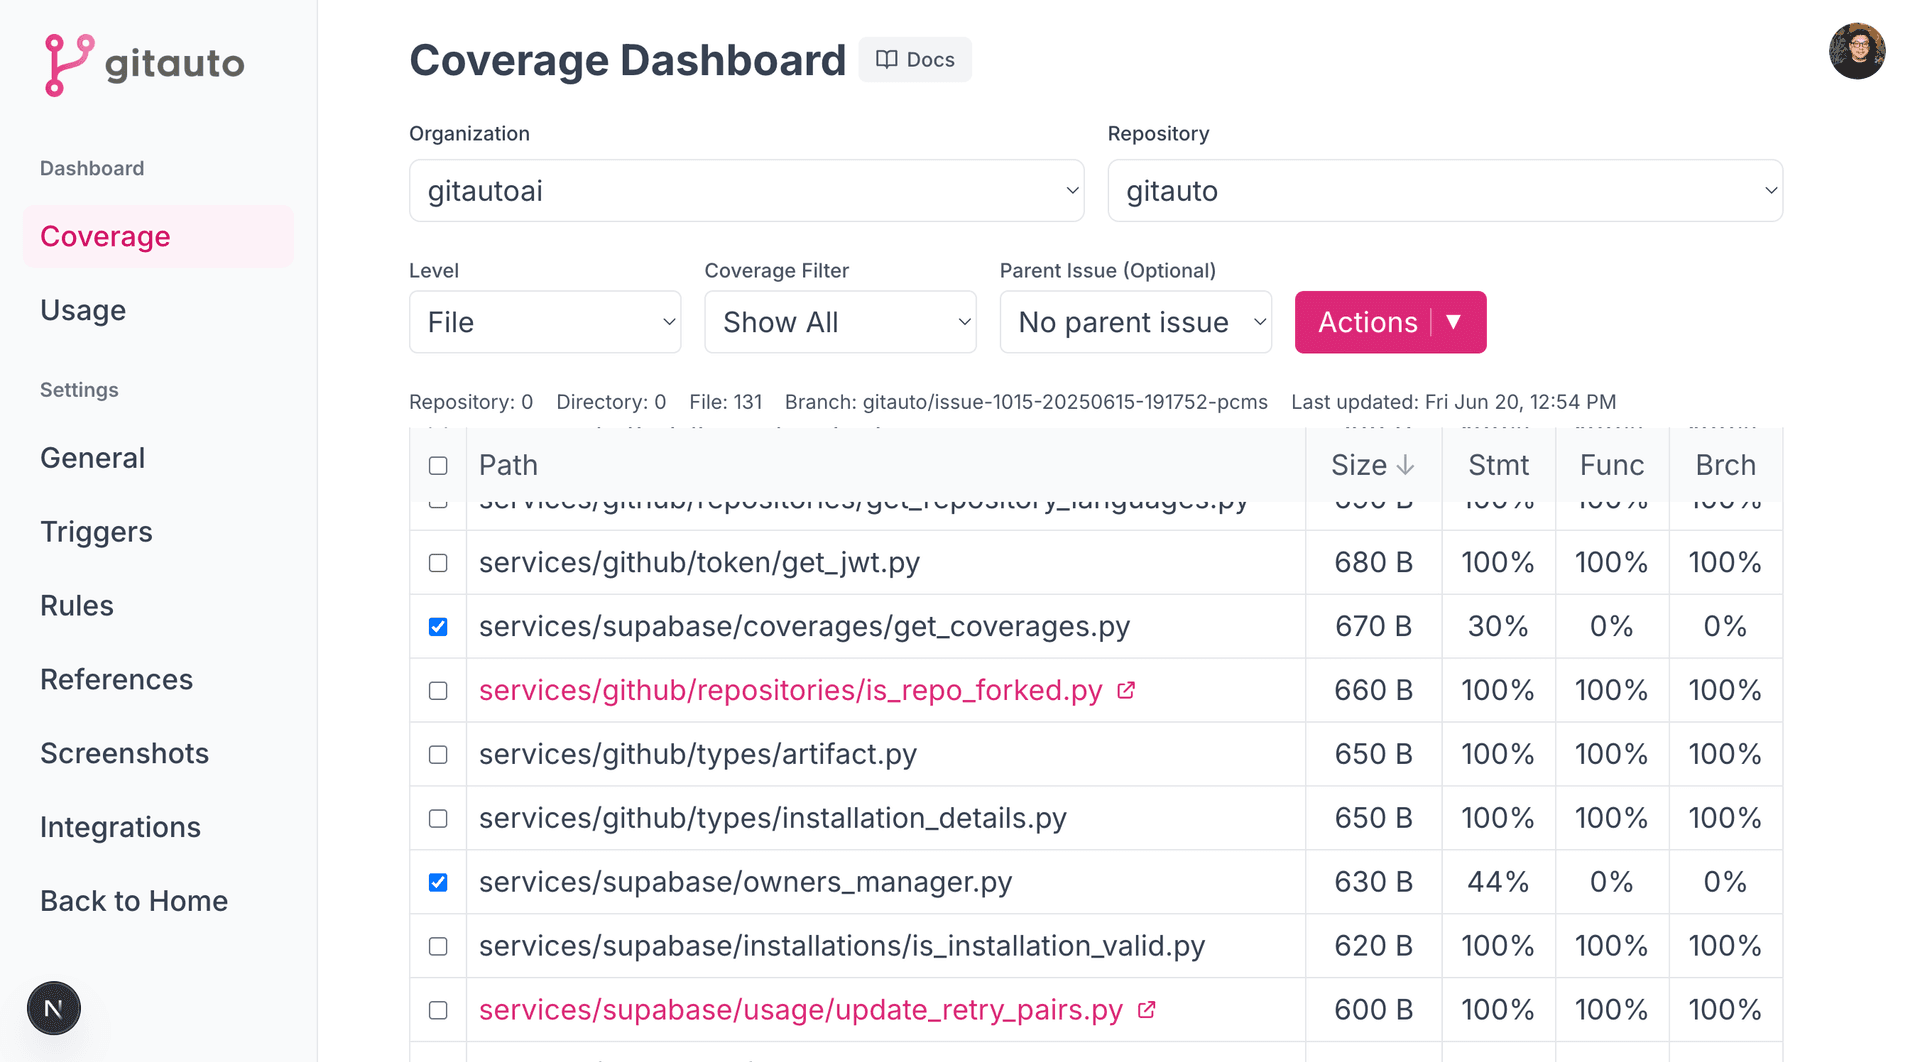
The dashboard displays a list of files in your repository. If you've integrated coverage reports, you'll see coverage percentages for each file.

Select files and generate tests
Check the boxes next to the files you want to generate tests for, then click the "Actions" button and select "Create PRs" to trigger GitAuto.
Usage Cost
1 Pull Request - Each trigger creates one pull request with generated tests.
Ready to explore your codebase? Visit the coverage dashboard and start selecting files for targeted test generation. Or learn more about the coverage dashboard to see how to use the coverage dashboard. Once you start improving your coverage, track your progress with the Coverage Charts
Dashboard Looking Empty?
Empty coverage in your dashboard usually means your coverage reports aren't making it through the pipeline. It's like having a beautiful sports car with no gas. Let's get your data flowing!
Contact us and fill up that dashboard!