Coverage Charts
Track your test coverage progress over time with GitAuto's Coverage Charts. Visualize your journey from low coverage to high-quality, well-tested code.
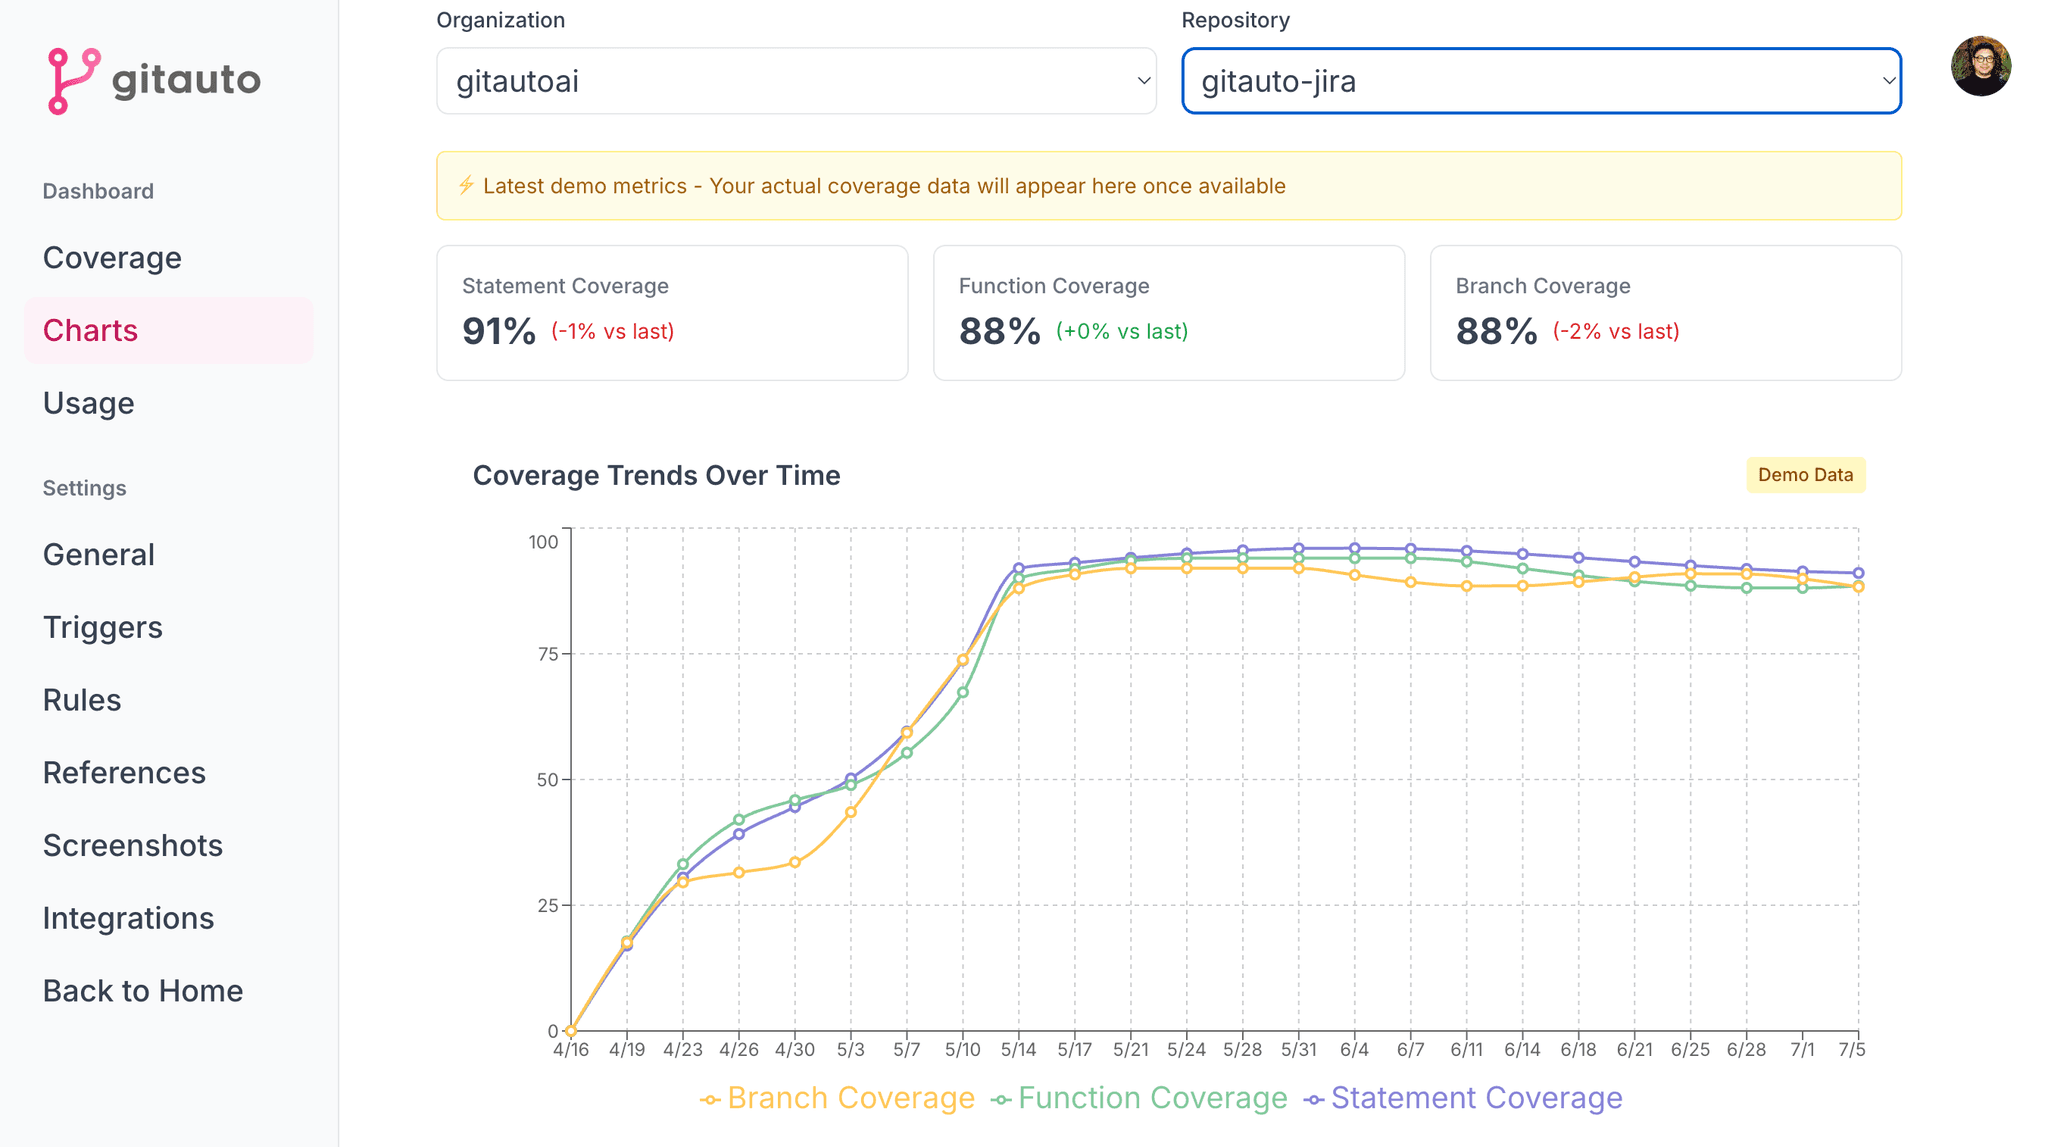
What are Coverage Charts?
Coverage Charts provide a visual representation of your test coverage evolution, helping you understand trends, track improvements, and identify areas that need attention.
You should focus on Statement Coverage - the most fundamental coverage metric that shows which lines of code are executed by your tests.
Why Focus on Statement Coverage?
While there are three main types of coverage (Statement, Function, and Branch), Statement Coverage is your starting point for several reasons:
- Foundation First: Statement coverage ensures basic code execution, forming the foundation for more advanced coverage types
- Immediate Impact:It's the most straightforward to understand and improve, giving you quick wins
- Practical Targets: Industry standards suggest 80% as a good target, 90% as excellent - 100% is often unnecessary and can be counterproductive
- Universal Understanding: Anyone can grasp the concept - from developers to business stakeholders and executives.
Setting Coverage Goals
Recommended Coverage Targets
- 🎯 80% - Good coverage, solid foundation
- 🏆 90% - Excellent coverage, high confidence
- ⚠️ 100% - Usually unnecessary, can become counterproductive
Remember: As coverage percentage increases, the effort required grows exponentially. Focus on meaningful tests rather than chasing perfect numbers.
Planning Your Coverage Journey
Step 1: Assess Current State
- Check your current coverage percentage
- Identify total number of files in your codebase
- Determine which files have the lowest coverage
Step 2: Set Realistic Goals
- Define your target coverage percentage (aim for 80%, then 90%)
- Set a realistic deadline for achieving your goal
- Calculate daily/weekly improvement needed
Step 3: Configure GitAuto Schedule
Use GitAuto's Schedule Trigger to automate your coverage improvements:
- Calculate execution frequency: Days remaining ÷ Files to improve
- Add buffer time for AI limitations and code complexity
- Account for files that might need refactoring before testing
Preparing Your Codebase
⚠️ Important Considerations
AI isn't perfect yet. Your codebase's structure significantly impacts test generation success:
- File Length: Extremely long files are harder to test comprehensively
- Function Complexity: Files with many functions increase test complexity
- Multiple Responsibilities: Files doing too many things create complex, hard-to-read tests
- Tight Coupling: Highly coupled code makes testing and mocking difficult
Consider refactoring problematic files before running GitAuto to improve success rates and test quality.
Multi-Language Repositories
For repositories with multiple programming languages, the charts display coverage separately for each language:
- Per-language charts:Each language gets its own chart (e.g., "my-repo (PHP)" and "my-repo (JavaScript)")
- Total coverage:The "Total Coverage" chart aggregates all languages across all repos using weighted averages based on lines of code
- Single-language repos: Repos with only one language show without the language suffix
See Multi-Language Coverage for setup instructions.
Using the Charts
Accessing Coverage Charts
Navigate to the Coverage Charts from your dashboard to view your coverage trends over time.
Interpreting the Data
- Trend Lines: Look for consistent upward trends in coverage percentage
- Plateaus: Flat periods might indicate need for strategy adjustment
- Dips: Temporary decreases are normal when adding new uncovered code
- Progress Rate:Track whether you're meeting your timeline goals
Taking Action
Use the charts to guide your next steps:
- If progress is slow, consider increasing GitAuto schedule frequency
- If tests are failing frequently, focus on code refactoring first
- If coverage is improving steadily, maintain your current approach
- When you hit your target, celebrate and share your success!
🎉 Share Your Achievement!
When you successfully improve your coverage, don't keep it to yourself! Share progress with your team and management, post about your success on social media or tech blogs, and don't forget to tell us about your journey! We love hearing success stories!
Contact us to share your coverage improvement journey!